Recent Posts
categories
Archives
- Tips to Lower your Electric BillPosted: 5 years ago
- 5 Easy Home Improvement Projects & Upgrades For the WinterPosted: 5 years ago
- Benefits to buying in the winterPosted: 5 years ago
- Cash In with a Cash-Out RefinancePosted: 5 years ago
- Mortgage MythsPosted: 5 years ago
- Q&A: All About Flooring — Hardwood, Carpeting, Tiling, LaminatePosted: 5 years ago
- Tip: 3 Foolproof Social Media Marketing TipsPosted: 6 years ago
- Tips for Hosting a Stress-Free Holiday DinnerPosted: 6 years ago
- Is a Mortgage Refinance Right for You?Posted: 6 years ago
- Check Your Disaster Supplies KitPosted: 6 years ago
- Create an Early Holiday Shopping BudgetPosted: 6 years ago
- 9 Ways to Make Moving Day EasierPosted: 6 years ago
- July 2018 Market Update – Twins Cities RegionPosted: 6 years ago
- Fall Homeowners ChecklistPosted: 6 years ago
- Scam Alert: Spoofed IRS Phone NumbersPosted: 6 years ago
- 15 Years of First Class MortgagePosted: 6 years ago
- How to buy a second homePosted: 6 years ago
- Q&A: Lawn Watering SecretsPosted: 6 years ago
- Troubleshoot Your Air ConditioningPosted: 6 years ago
- Your Mortgage, What to Expect: Clear To ClosePosted: 6 years ago
- Twins Cities Region Monthly Indicators – APRIL 2018Posted: 6 years ago
- Your Mortgage, What to Expect: UnderwritingPosted: 6 years ago
- Your Mortgage, What To Expect: Property AppraisalPosted: 6 years ago
- 3 Tips to Improve your Credit Score and Score a Lower Interest RatePosted: 6 years ago
- Changing Interest Rates Have A High Impact On Purchasing PowerPosted: 6 years ago
- The Myth of Multiple Mortgage Credit InquiriesPosted: 6 years ago
- Things to do BEFORE you buy a home.Posted: 6 years ago
- March Tech Tip: Pack Smarter With PackPointPosted: 6 years ago
- 4 Ways to Pay Off Your Mortgage EarlyPosted: 6 years ago
- Clean House in a HurryPosted: 6 years ago
- Your Mortgage, What To Expect: Document ReviewPosted: 7 years ago
- Chill Winter Utility BillsPosted: 7 years ago
- Six Tips to Help Your Home Sell This FallPosted: 7 years ago
- 4 Things to Know About Closing CostsPosted: 7 years ago
- Understanding Your Credit ScorePosted: 7 years ago
- Equifax Data Breach: What should you do now?Posted: 7 years ago
- Should You Refinance Your FHA to a Conventional Loan?Posted: 7 years ago
- 6 Ways to Save on Paint ProjectsPosted: 7 years ago
- Q&A: Mortgage InsurancePosted: 7 years ago
- How to Keep Your House Cool this SummerPosted: 7 years ago
- Mortgage Education: “What’s the Point?”Posted: 7 years ago
- Q&A: Spotting a Spoof SitePosted: 7 years ago
- Moving ChecklistPosted: 7 years ago
- Squash Marital Money SquabblesPosted: 7 years ago
- April 2017: Twin Cities Real Estate Market UpdatePosted: 7 years ago
- Your Spring Guide to Home StagingPosted: 7 years ago
- March 2017: Twin Cities Real Estate Market UpdatePosted: 7 years ago
- Don’t be a Victim — Four Ways Protect Yourself from Refinance ScamsPosted: 7 years ago
- Local Market Update: Minneapolis Area Association of RealtorsPosted: 7 years ago
- First-Time Homebuyers: Where to startPosted: 7 years ago
- Dear First Class Mortgage:Posted: 7 years ago
- First Class Mortgage. Our Expertise, Your Peace of Mind.Posted: 8 years ago
11
September
July 2018 Market Update – Twins Cities Region
Posted byJuly 2018
Housing price bubble chatter has increased this summer, as market observers attempt to predict the next residential real estate shift. It is too early to predict a change from higher prices and lower inventory, but the common markers that caused the last housing cooldown are present.
Wages are up but not at the same pace as home prices, leading to the kind of affordability concerns that can cause fewer sales at lower prices. At the same time, demand is still outpacing what is available for sale in many markets.
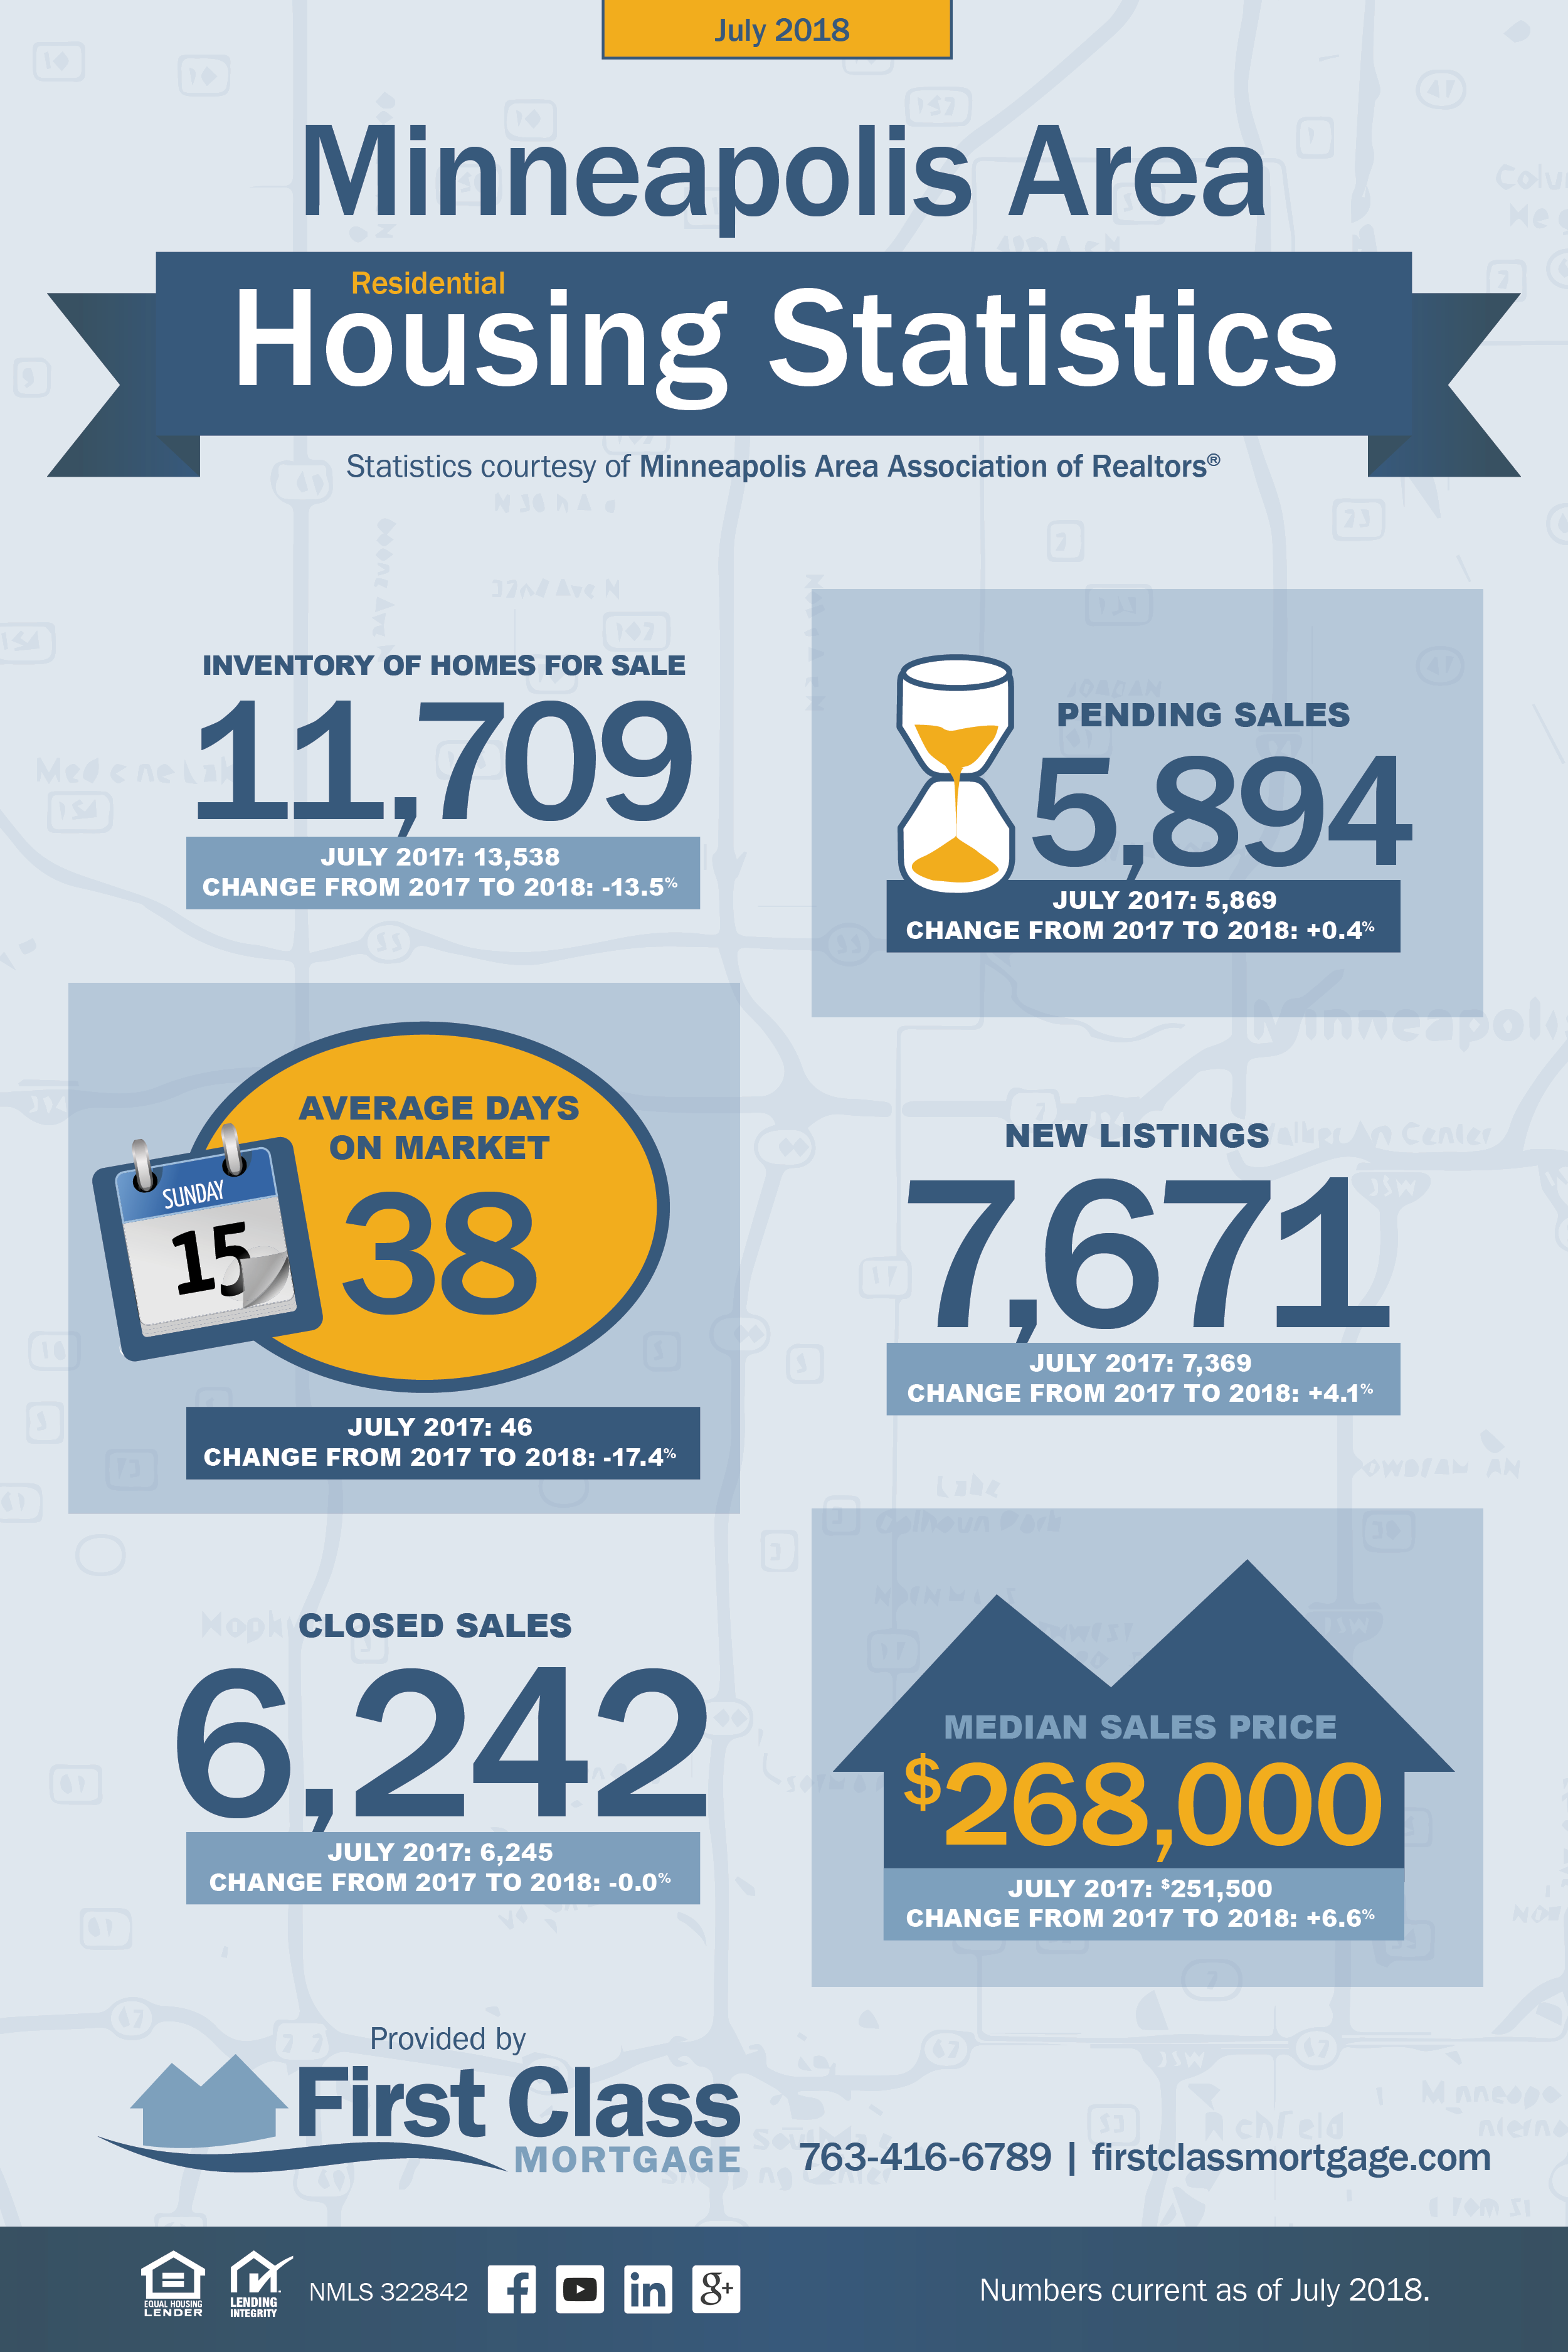
- New Listings in the Twin Cities region increased 4.1 percent to 7,671.
- Pending Sales were up 0.4 percent to 5,894.
- Inventory levels fell 13.5 percent to 11,709 units.
- Prices continued to gain traction.
- The Median Sales Price increased 6.6 percent to $268,000.
- Days on Market was down 17.4 percent to 38 days.
- Sellers were encouraged as Months Supply of Homes for Sale was down 11.1 percent to 2.4 months.
Consumer spending on home goods and renovations are up, and more people are entering the workforce. Employed people spending money is good for the housing market. Meanwhile, GDP growth was 4.1% in the second quarter, the strongest showing since 2014.
Housing starts are down, but that is more reflective of low supply than anything else. With a growing economy, solid lending practices and the potential for improved inventory from new listing and building activity, market balance is more likely than a bubble.
Source: NorthstarMLS, MINNEAPOLIS AREA ASSOCIATION OF REALTORS®
17
April
March 2017: Twin Cities Real Estate Market Update
Posted by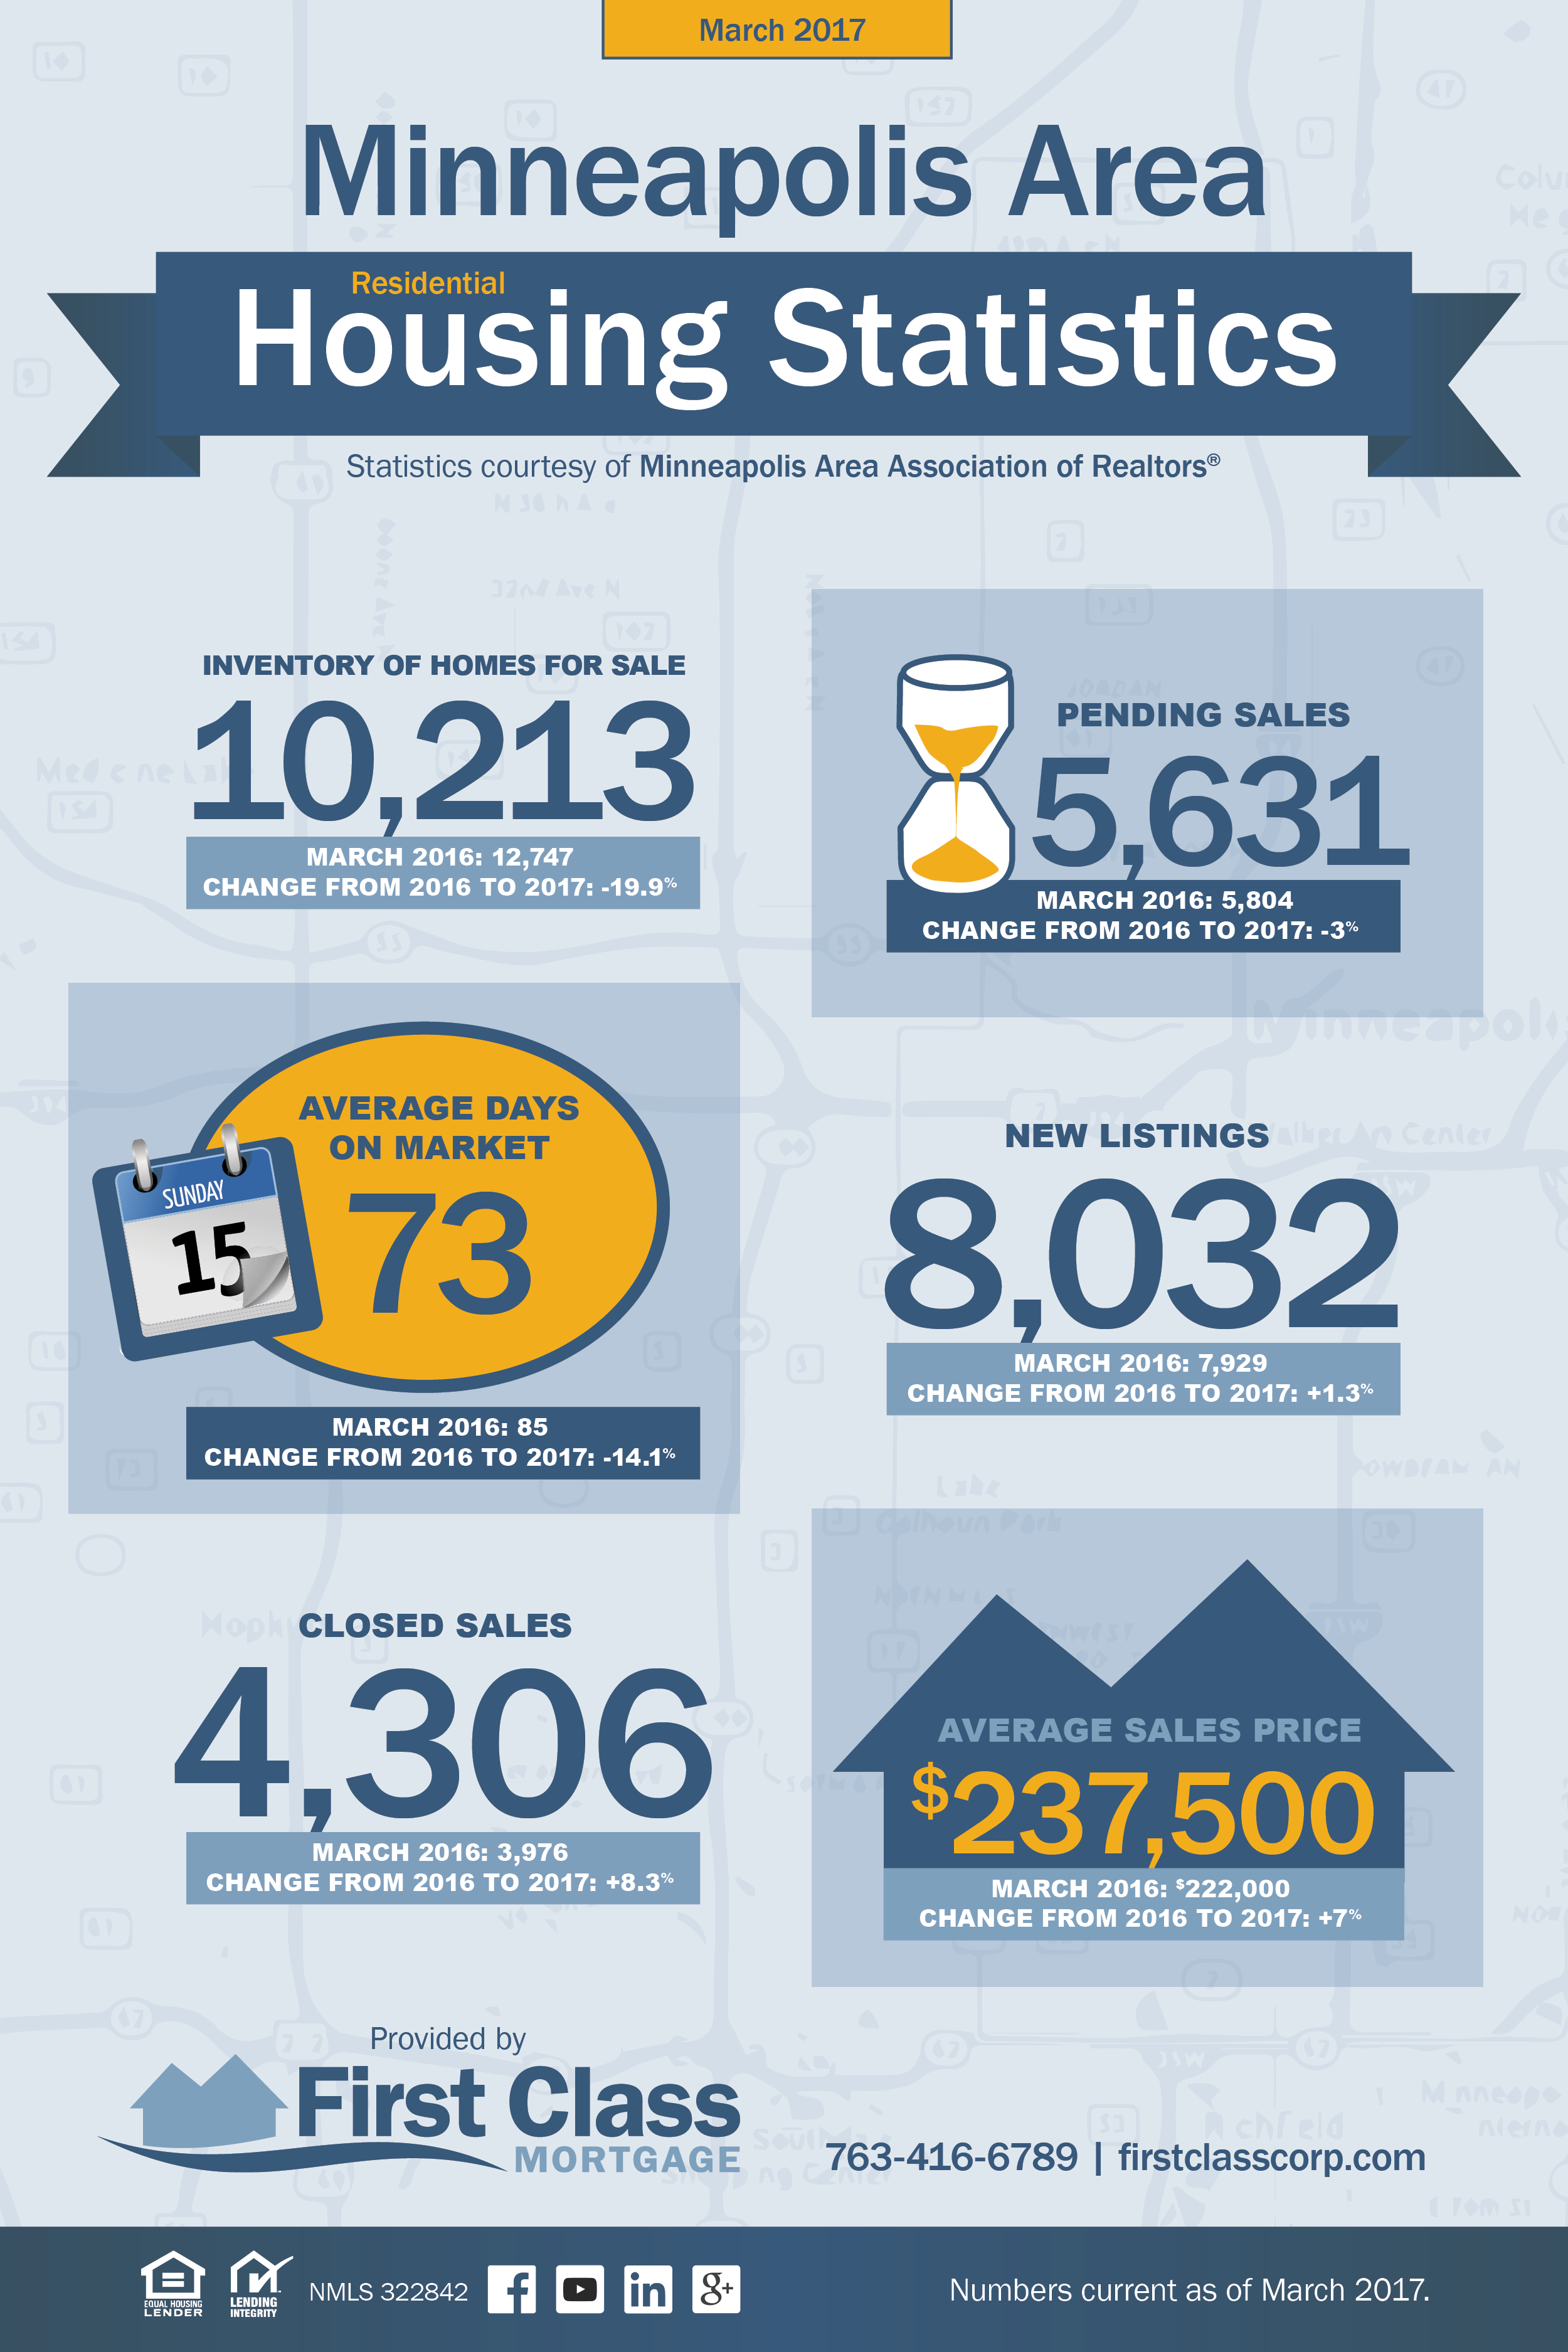 We can comfortably consider the first quarter to have been a good start for residential real estate in 2017.
There was certainly plenty to worry over when the year began. Aside from new national leadership in Washington, DC, and the policy shifts that can occur during such transitions, there was also the matter of continuous low housing supply, steadily rising mortgage rates and ever-increasing home prices. Nevertheless, sales have held their own in year-over-year comparisons and should improve during the busiest months of the real estate sales cycle.
New Listings in the Twin Cities region increased 1.3 percent to 8,032. Pending Sales were down 3.0 percent to 5,631. Inventory levels fell 19.9 percent to 10,213 units.
Prices continued to gain traction. The Median Sales Price increased 7.0 percent to $237,500. Days on Market was down 14.1 percent to 73 days. Sellers were encouraged as Months Supply of Homes for Sale was down 23.1 percent to 2.0 months.
The U.S. economy has improved for several quarters in a row, which has helped wage growth and retail consumption increase in year-over-year comparisons. Couple that with an unemployment rate that has been holding steady or dropping both nationally and in many localities, and consumer confidence is on the rise. As the economy improves, home sales tend to go up. It isn’t much more complex than that right now. Rising mortgage rates could slow growth eventually, but rate increases are little more than a byproduct of the strong economy and high demand.
Source: Minneapolis Area Association of Realtors®, Monthly Indicators Report. All data comes from NorthstarMLS. http://maar.stats.10kresearch.com/reports
Mortgage Services
Tools
About Us
