Recent Posts
categories
Archives
- Tips to Lower your Electric BillPosted: 5 years ago
- 5 Easy Home Improvement Projects & Upgrades For the WinterPosted: 5 years ago
- Benefits to buying in the winterPosted: 5 years ago
- Cash In with a Cash-Out RefinancePosted: 5 years ago
- Mortgage MythsPosted: 5 years ago
- Q&A: All About Flooring — Hardwood, Carpeting, Tiling, LaminatePosted: 5 years ago
- Tip: 3 Foolproof Social Media Marketing TipsPosted: 6 years ago
- Tips for Hosting a Stress-Free Holiday DinnerPosted: 6 years ago
- Is a Mortgage Refinance Right for You?Posted: 6 years ago
- Check Your Disaster Supplies KitPosted: 6 years ago
- Create an Early Holiday Shopping BudgetPosted: 6 years ago
- 9 Ways to Make Moving Day EasierPosted: 6 years ago
- July 2018 Market Update – Twins Cities RegionPosted: 6 years ago
- Fall Homeowners ChecklistPosted: 6 years ago
- Scam Alert: Spoofed IRS Phone NumbersPosted: 6 years ago
- 15 Years of First Class MortgagePosted: 6 years ago
- How to buy a second homePosted: 6 years ago
- Q&A: Lawn Watering SecretsPosted: 6 years ago
- Troubleshoot Your Air ConditioningPosted: 6 years ago
- Your Mortgage, What to Expect: Clear To ClosePosted: 6 years ago
- Twins Cities Region Monthly Indicators – APRIL 2018Posted: 6 years ago
- Your Mortgage, What to Expect: UnderwritingPosted: 6 years ago
- Your Mortgage, What To Expect: Property AppraisalPosted: 6 years ago
- 3 Tips to Improve your Credit Score and Score a Lower Interest RatePosted: 6 years ago
- Changing Interest Rates Have A High Impact On Purchasing PowerPosted: 6 years ago
- The Myth of Multiple Mortgage Credit InquiriesPosted: 6 years ago
- Things to do BEFORE you buy a home.Posted: 6 years ago
- March Tech Tip: Pack Smarter With PackPointPosted: 6 years ago
- 4 Ways to Pay Off Your Mortgage EarlyPosted: 6 years ago
- Clean House in a HurryPosted: 6 years ago
- Your Mortgage, What To Expect: Document ReviewPosted: 7 years ago
- Chill Winter Utility BillsPosted: 7 years ago
- Six Tips to Help Your Home Sell This FallPosted: 7 years ago
- 4 Things to Know About Closing CostsPosted: 7 years ago
- Understanding Your Credit ScorePosted: 7 years ago
- Equifax Data Breach: What should you do now?Posted: 7 years ago
- Should You Refinance Your FHA to a Conventional Loan?Posted: 7 years ago
- 6 Ways to Save on Paint ProjectsPosted: 7 years ago
- Q&A: Mortgage InsurancePosted: 7 years ago
- How to Keep Your House Cool this SummerPosted: 7 years ago
- Mortgage Education: “What’s the Point?”Posted: 7 years ago
- Q&A: Spotting a Spoof SitePosted: 7 years ago
- Moving ChecklistPosted: 7 years ago
- Squash Marital Money SquabblesPosted: 7 years ago
- April 2017: Twin Cities Real Estate Market UpdatePosted: 7 years ago
- Your Spring Guide to Home StagingPosted: 7 years ago
- March 2017: Twin Cities Real Estate Market UpdatePosted: 7 years ago
- Don’t be a Victim — Four Ways Protect Yourself from Refinance ScamsPosted: 7 years ago
- Local Market Update: Minneapolis Area Association of RealtorsPosted: 7 years ago
- First-Time Homebuyers: Where to startPosted: 7 years ago
- Dear First Class Mortgage:Posted: 7 years ago
- First Class Mortgage. Our Expertise, Your Peace of Mind.Posted: 8 years ago
01
June
Twins Cities Region Monthly Indicators – APRIL 2018
Posted by
Many sellers and builders are in a good position for financial gains, as the economy continues to favor putting existing homes on the market and building new homes for sale. We are finally beginning to see some upward movement in new listings after at least two years of a positive outlook. There may not be massive increases in inventory from week to week, but a longer-term trend toward more new listings would be a good sign. Low inventory should continue to create a competitive situation for buyers, causing price increases over the next several months.
Quick Stats: 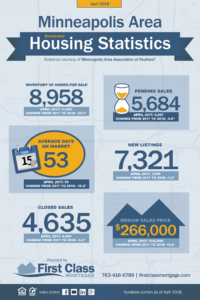
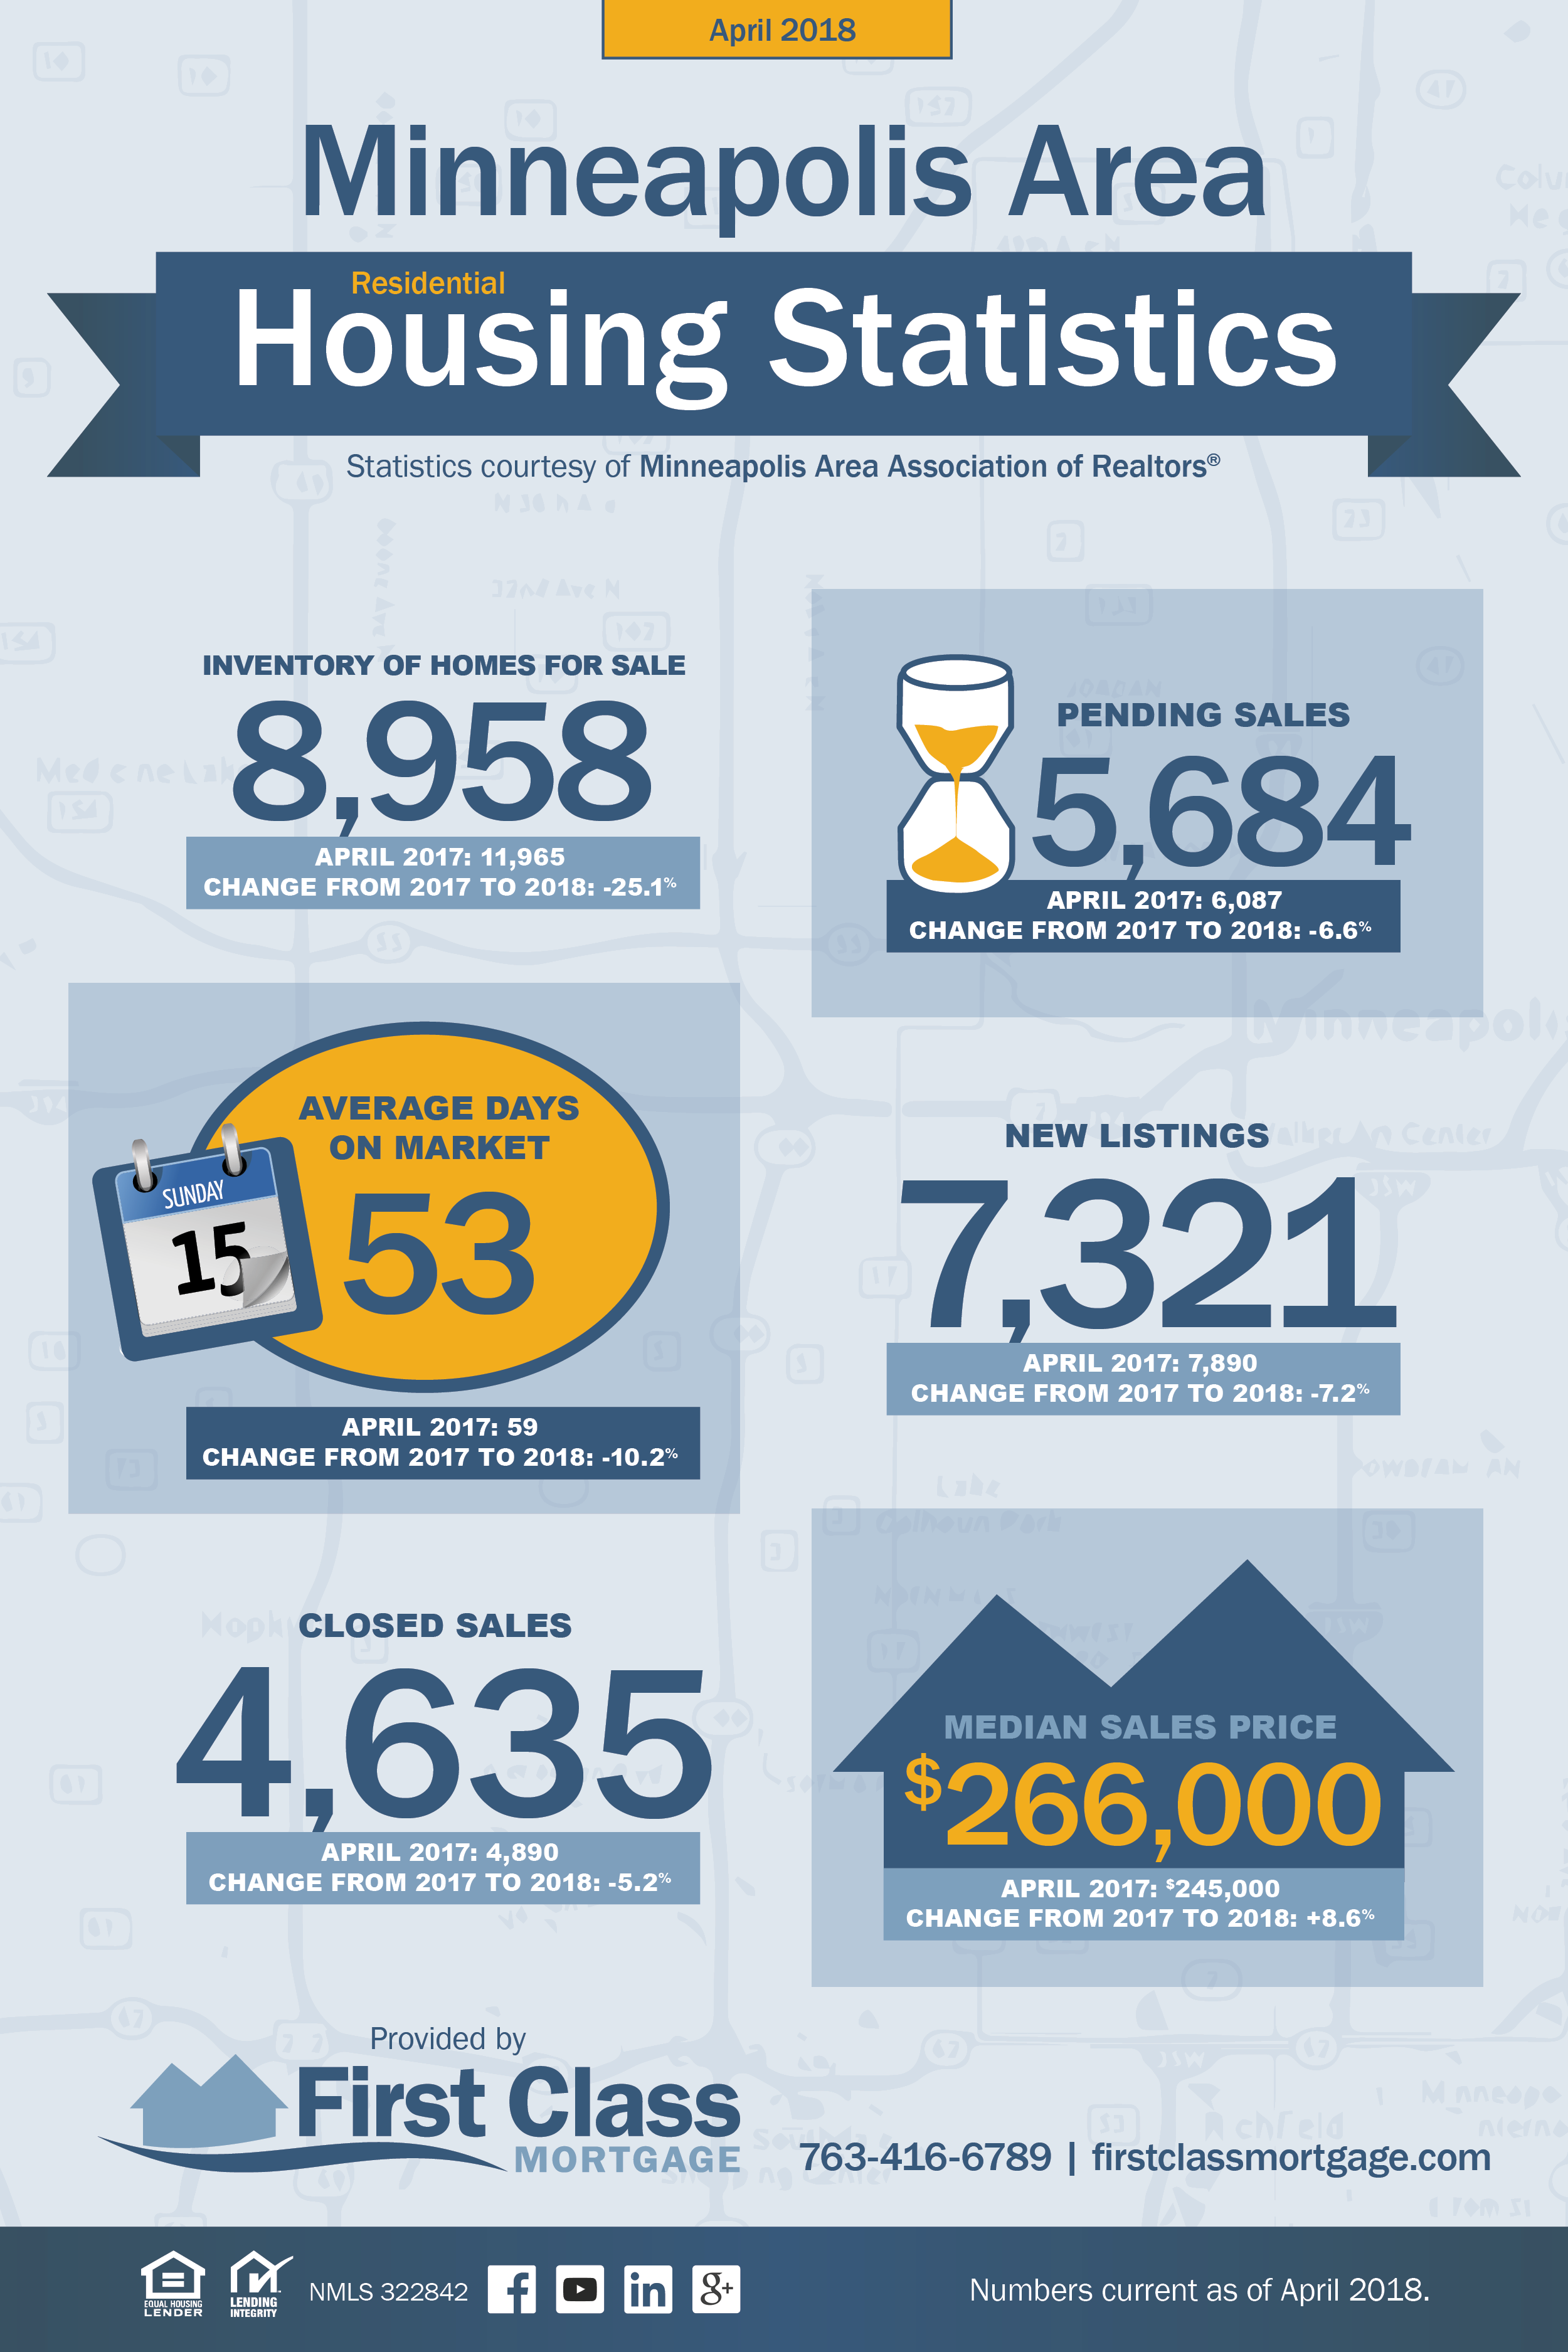
∙ New Listings in the Twin Cities region decreased 7.2 percent to 7,321.
∙ Pending Sales were down 6.6 percent to 5,684.
∙ Inventory levels fell 25.1 percent to 8,958 units.
∙ Median Sales Price increased 8.6 percent to $266,000.
∙ Days on Market was down 10.2 percent to 53 days.
∙ Months Supply of Homes for Sale was down 25.0 percent to 1.8 months.
This winter and spring exhibited unseasonal weather patterns in much of the country. As the seasons change to something more palatable, wages and consumer spending are both up, on average, which should translate positively for the housing market. Being quick with an offer is still the rule of the day as the number of days a home stays on the market drops lower. Along with the purchase market, buyers should be aware of pending mortgage rate increases. Acting now could potentially help them secure a lower interest rate.
Mortgage Services
Tools
About Us
